Keeping vLLM's Prefix Cache Warm Between Agent Turns
From 55% to 95% cached 🔗
I’ve been playing with a few different ways to host Qwen3.8 locally. I’m aiming for something that can replace Claude Code for most of my tasks. Right now the 27B runs on two RTX 3090s under vLLM, and it’s usable, but the first day was rough. In the morning the wait before the first word averaged about half a minute, and some replies took several minutes. The time went into rereading large parts of every prompt from scratch, because the cached copy from the previous turn had been thrown away or no longer matched. By the evening the server was keeping almost everything from one turn to the next.
| Morning | Evening | |
|---|---|---|
| Prompt tokens served from cache | 55% | 95% |
| Average wait before the first word | 26-28 s | 7.3 s |
| Worst wait | 514 s | 54 s |
The agent-side settings from that day are in Tuning a Local Coding Agent.
The stack is oh-my-pi talking to Bifrost, an LLM gateway that also aggregates the MCP tool servers, talking to vLLM 0.28.0, serving a W4A16 AutoRound quant across both cards:
--tensor-parallel-size 2 --max-model-len 262144 --max-num-seqs 16
--max-num-batched-tokens 8192 --long-prefill-token-threshold 2048
--kv-transfer-config '{"kv_connector":"OffloadingConnector", ...}'
Between the two columns I also combined the two cards with tensor parallelism instead of running a replica on each, capped thinking at 6,000 tokens, changed the batch token budget, and turned on speculative decoding and CPU offload.
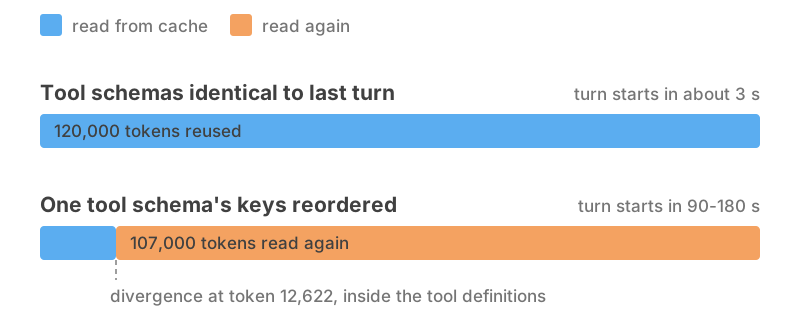
A coding agent resends the whole conversation every turn. Reading it runs at 700-900 tokens per second per request on the combined engine, so a 120,000-token turn takes about 150 seconds from scratch. If the server still has the previous turn’s work in its KV cache, it reads only the new 2,000 tokens or so and starts in 3 seconds.
What the server keeps, and where 🔗
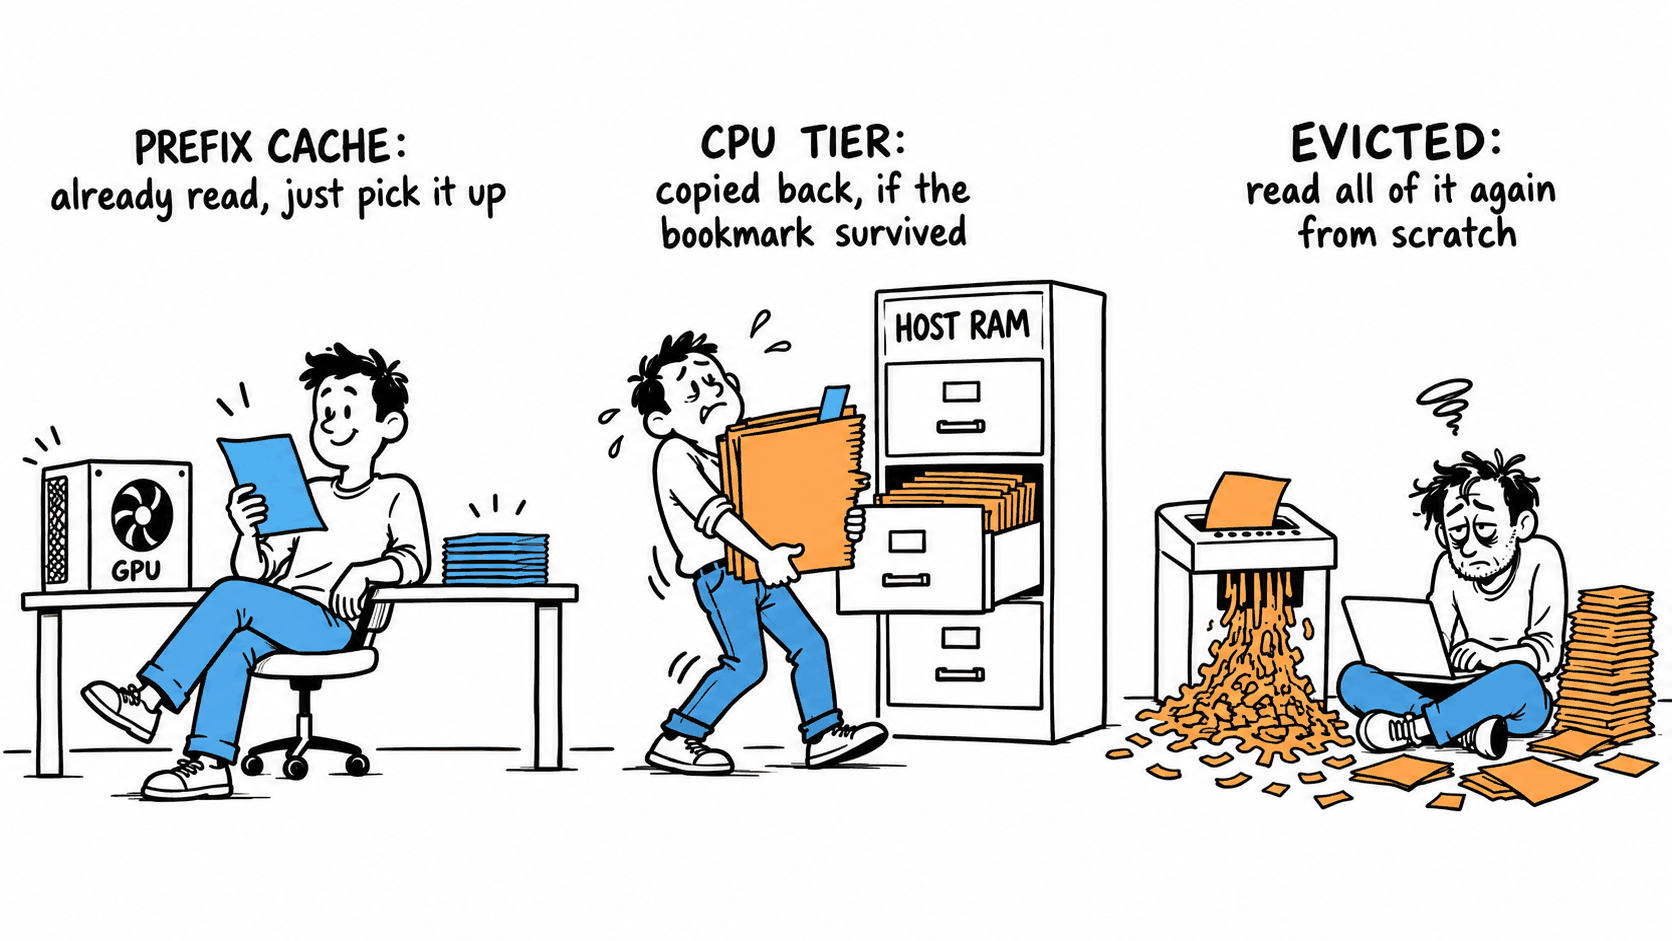
The GPU prefix cache holds the results of reading tokens, indexed by a hash of each block together with every block before it. A lookup walks the prompt from the start and stops at the first block that doesn’t match. It matches a prefix rather than diffing two prompts, so a change at token 12,000 of a 120,000-token prompt throws away 108,000 tokens of finished work.
The CPU tier copies blocks evicted from GPU memory to host RAM (48 GiB in /dev/shm here) and
copies them back on demand. While I was still running two replicas, each had room for two or three
long conversations, so contexts were evicted all day, and a restore over PCIe brought a whole
42,000-token context back in under half a second where reading it cold on that replica took 24
seconds. Once I combined the cards with tensor parallelism the restores dropped to about two an hour.
Anything in neither tier is read again from scratch.
vLLM also documents a filesystem tier and a peer-to-peer connector. I looked at them for sharing KV between the two per-GPU replicas I started with, and combining the cards removed the need. The filesystem tier also never evicts anything.
Measuring it 🔗
Watch prompt_tokens_cached_total / prompt_tokens_total, the share of prompt tokens the server didn’t
have to read. The GPU hit counter alone looked healthy on my morning run while that share was 55%.
What the hybrid model changes 🔗
Qwen3.8-27B is a hybrid: most of its layers use a linear attention variant that keeps a small fixed amount of state instead of a KV cache that grows with the prompt. vLLM can only resume those layers from a saved copy of that state, and it only saves one where a prefill step ends on a 2048-token boundary, so on this model the cache works in 2048-token blocks instead of the usual 16.
A 2048-token block also changes what the scheduler can fit: a request with less than 2048 tokens of
batch budget left in a step gets nothing that step, and the scheduler stops looking at the queue
behind it. With
--max-num-batched-tokens 4096 long requests sat queued behind a single prefill. 8192 with
--long-prefill-token-threshold 2048 fits three or four prefill chunks in a step instead of one, and a
bigger budget than that stalled decoding for 13-19 seconds a step.
The same saved states are why the CPU tier stopped helping. vLLM keeps only a few of them per conversation, mainly the one where the last request ended, and drops the rest. The next turn starts exactly there, so the GPU cache serves it. A restore from the CPU tier only helps if a saved state still exists at the boundary where the restored blocks end, and one rarely does. The combined pool is also far bigger than either replica’s and peaked at 37% full during the evening run, so little is evicted in the first place. One hour of agent traffic on the combined setup looked like this:
| Over one hour | |
|---|---|
| Copied to RAM | ~40 GB in ~700 copies |
| Restored from RAM | ~250 MB in 2 restores |
| Tokens asked for | ~800,000 |
| Tokens served | ~12,000 (1.5% of those asked for) |
| Cost | ~9 s of copying, 48 GiB of RAM |
Other hours on it looked the same. I leave it on because it costs so little, but on this model it can’t do much.
What breaks the prefix 🔗
Tool schemas that shuffle their keys 🔗
Every hour or so, a few turns came back 2-25% cached with 90-180 seconds of reading, on an idle engine with the KV pool almost empty, from prompts 94-96% identical to the previous turn.
Replaying pairs of consecutive turns from a traffic capture against an idle server reproduced the misses, so it wasn’t eviction. Tokenizing both prompts and diffing them showed they matched for exactly 12,622 tokens and then diverged inside the tool definitions. Four MCP tools had arrived with the keys of their parameter schema in a different order, on 8% of consecutive turns in the capture. The schemas were identical once sorted. The Qwen template renders the tool definitions at the top of the system turn, before the system prompt itself, so one shuffled schema invalidated everything behind it.
The shuffle comes from the gateway: mcp-go decodes each MCP server’s tool list into a Go map, which
has no key order, and Bifrost copies that map back out with a range loop, which Go deliberately
randomizes. Bifrost refreshes its tool list every 10 minutes, so the order it serves can change on any
refresh, and the order changes in the capture were spaced at multiples of 10 minutes.
I sent fixes for both and they’re merged: bifrost#7170 sorts the schema keys during conversion, and mcp-go#984 records the key order while decoding so a gateway can keep the server’s own order. Before that, my workaround was in the chat template. Where the Qwen template serializes each tool’s parameters, I changed
tool.function.parameters | tojson
to
tool.function.parameters | tojson(sort_keys=True)
so the keys come out in the same order whatever order they arrive in. Everything else I changed that day had taken the cached share from 55% to 78%. The template edit on its own took it from 78% to 95%, and the average wait from 21 seconds to 7.3. Hosted APIs match a byte-identical prefix that includes the tools block too, so the same gateway bug would have cost the cached read discount there.
Live status text near the top of the prompt 🔗
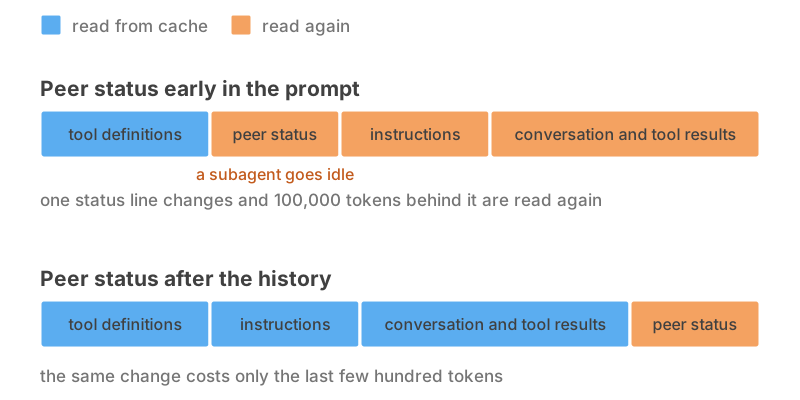
oh-my-pi lists each subagent’s state (running, idle, parked) roughly 29,000 characters into the system prompt, so every state change invalidated the main agent’s prompt from that point on. After one 24-minute subagent run, the main agent came back to a 150,000-token prompt with 14% of it cached. The block is hardcoded in oh-my-pi’s prompt template, so the fix belongs upstream, and I haven’t asked yet why it’s there.
Compaction 🔗
When the conversation gets too long, the agent replaces old history with a summary. A summary changes the prompt, so the turn after compaction reads all of it again. The only lever is how often it runs: tell the agent the model’s real context window and raise the threshold, both covered in Tuning a Local Coding Agent.
Per-agent text before shared text 🔗
Each subagent’s prompt has its own id and peer list about two thirds of the way through the system prompt, so sibling subagents share only the first 60-70% of their prefix. The main agent and subagents also list their tools in different orders, so they diverge. Putting the shared parts (tool definitions and base instructions) first and the per-agent parts last would let every agent share the same first 15,000 tokens or so. As with the status block, the order may be Chesterton’s fence, and I haven’t asked.
What doesn’t break it 🔗
Appending tool results, which is most of an agent’s traffic, extends the prefix and leaves everything before it cached. Big tool outputs still cost reading time, and capping them is a separate problem.
Benchmark with the cache you will run with 🔗
Speculative decoding looked bad in the morning: it doubled the writing speed per stream (63 tokens per second against 27), but its slower reading made overlapping requests queue, and the median wait went from 29 seconds to 121. At 95% cached there’s hardly any reading left to slow down, and it became the better mode: 24-32 tokens per second per request against ~22, with a shorter wait.
A checklist 🔗
- Measure the share of prompt tokens served from cache, not the number of cache hits.
- When a turn is slow, tokenize it and the previous turn and find the first token that differs.
- Reproduce the miss against an idle server before blaming eviction.
- Serialize everything that goes into the prompt the same way every time. Sort JSON keys.
- Once that holds, put the parts of the prompt that change at the end: tool definitions and fixed instructions first, then history, then anything per-agent or live.
- Compact as rarely as your agent allows.
- Report the cache hit rate with any benchmark number.
I had help with this one. Anthropic’s Claude and the local Qwen models described here helped me dig through the traffic captures, write the replay script and draft this post. I ran the experiments, checked the numbers and rewrote anything that sounded like a chatbot, so the mistakes are mine.
Sources 🔗
- vLLM automatic prefix caching
- vLLM KV offloading
- vLLM prefix caching on hybrid models with speculative decoding: #53670 and #53504
- vLLM
mamba_cache_modeandprefix_cache_retention_interval: vllm/config/cache.py - Bifrost MCP tool schema key order: issue #7169 and PR #7170
- mcp-go property order: issue #983 and PR #984
- oh-my-pi
- Qwen3.8-27B model card and chat template
- Model weights
- syv-ai RTX 3090 vLLM image